Highlights
📊 All Markets
💻 MetaTrader 4
🔓 Unlimited
♻️ Assets: All
⏰ Timeframes: Any
🤖 Auto-trade this indicator with NIREDO iTrade Bot
Description
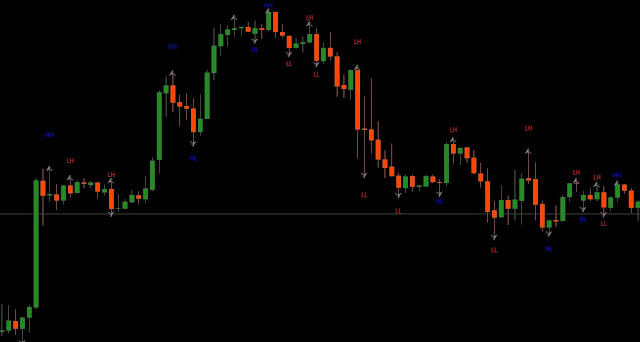
HIGHER HIGH LOWER LOW Indicator helps traders understand the trends in the market. It shows higher highs and lower lows pattern formations that can be used for identifying whether the market is on the uptrend or on the downtrend.
What Are Highs and Lows in Trading?
Higher high: The asset is forming a higher high when its price closes above the highs it had made in the previous sessions. This gives the trader the confidence that the price will likely rise in the future.
Higher low: Higher lows are formed when the price of the asset closes at a lower price but sustains above the previous lows in the market. This gives the trader an indication that the uptrend is going to sustain.
Lower low: When the price of the asset closes at a lower price than it did in the previous sessions, it can be referred to as a lower low. This pattern gives the trader the confidence that the price can dip further in the future.
Lower high: Lower highs are formed when the price of the asset closes higher but sustains below the previous high of the market. This gives the trader an indication that the upper trend is dipping the market and the price can likely decline in the future.
Higher High Lower Low Trading Strategy
When the uptrend is identified, you can go buy when the price makes a higher low and go sell when the price makes a new higher high. This process can be repeated until the trend is exhausted.
It is important to closely watch the support level for the price while trading this trend. The price should not go below the previous higher low. If it goes below this level the trader must execute a stop-loss on the position.
When the downtrend is identified, you can open a sell position when the price makes a lower high and open a buy position when the price makes a new lower low. This process can be repeated until the trend is exhausted.
Support level here would be the previous lower high. If the price goes above this level, the trader must execute a stop-loss on the position.
Higher High Lower Low Indicator in Action


