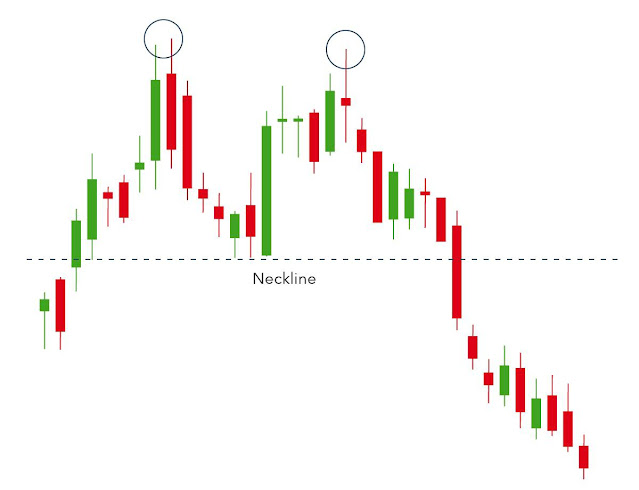
How to identify and trade DOUBLE TOP Chart Pattern?
The double top pattern is a frequently seen technical analysis pattern in the market and is used by traders and investors to make decisions about buying and selling. It is formed when the price of an asset reaches a new high, but then fails to break through that level and falls back down, only to attempt to reach the high again and fail again. The two peaks that are formed are roughly equal and are separated by a moderate trough.
The pattern is considered to be a bearish reversal signal because it suggests that the previous upward price trend has lost momentum and that the price is likely to fall. Traders and investors may use the double top pattern to make decisions about selling their positions.
To confirm the double top pattern, it is important to wait for the price to fall below the support level created by the trough or neckline. This confirms that the upward trend has indeed reversed and that the price is likely to continue to fall. Traders and investors may use this signal to enter short positions or sell their long positions.Once the pattern is confirmed, determine the target price. Measure the distance between the two peaks and project it downward from the support level to determine a potential target price for the asset.To limit the risk of the trade, place a stop-loss order above the neckline or above the previous high.
It's important to note that technical analysis is just one of many factors to consider when making investment decisions. Traders and investors should always consider additional fundamental and economic factors, as well as their own risk tolerance, before making a trade. Additionally, it's recommended to always use proper risk management techniques, such as stop-loss orders, to limit potential losses.


